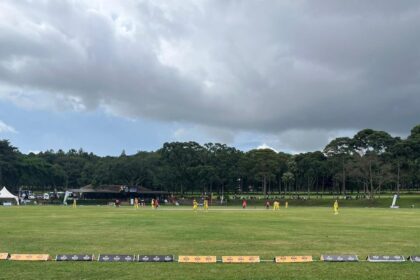
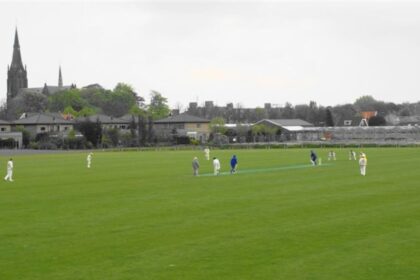
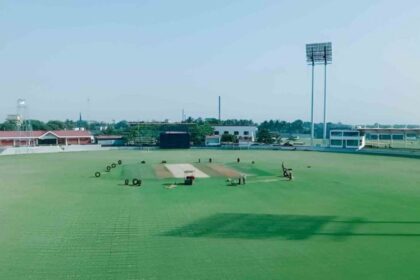
Trent Bridge, renowned as one of the world’s most picturesque cricket grounds is located in Nottingham and boasts an iconic 1889 pavilion that uniquely angles towards the wicket. Recent upgrades include the modern Radcliffe Road Cricket Centre (1998) and the award-winning Fox Road Stand (2002), featuring a distinctive aircraft-wing roof.
About
| Also known as | Trent Bridge Ground |
|---|---|
| Established | 1841 |
| Capacity | 17,000 |
| End Names | Stuart Broad End, Radcliffe Road End |
| Home Teams | Nottinghamshire |
| Pitch | Grass |
| Current Time | 08:25 AM UTC |
Records
ODI
| Total Matches Played | 54 |
|---|---|
| Batting 1st Won | 22 |
| Batting 2nd Won | 29 |
| Average 1st Innings Score | 252 |
T20
| Total Matches Played | 73 |
|---|---|
| Batting 1st Won | 43 |
| Batting 2nd Won | 29 |
| Average 1st Innings Score | 171 |
T20I
| Total Matches Played | 14 |
|---|---|
| Batting 1st Won | 8 |
| Batting 2nd Won | 6 |
| Average 1st Innings Score | 166 |
WT20I
| Total Matches Played | 1 |
|---|---|
| Batting 1st Won | 1 |
| Average 1st Innings Score | 145 |
WODI
| Total Matches Played | 3 |
|---|---|
| Batting 2nd Won | 3 |
| Average 1st Innings Score | 163 |
Test
| Total Matches Played | 69 |
|---|---|
| Batting 1st Won | 26 |
| Batting 2nd Won | 18 |
| Average 1st Innings Score | 327 |
| Average 2nd Innings Score | 311 |
| Average 3rd Innings Score | 265 |
| Average 4th Innings Score | 160 |
Further redevelopment in 2007-2008 increased capacity to 17,500, with the new stand officially opened by Prince Philip. With ends named the Stuart Broad and Radcliffe Road, this historic ground, home to Nottinghamshire, has hosted Test cricket since 1899 and witnessed many memorable moments.
Trent Bridge, Nottingham Pitch Report
The pitch at Trent Bridge, Nottingham offers a balanced track that favours both the batters and bowlers. It is traditionally a bowling friendly track in Test matches, where it swings laterally off the surface making it hard for the batters. The average scores in test matches at this venue is around 300-350 runs. It drops down to 160 runs in the 4th innings.
When it comes to ODI cricket the conditions are much better for batsman and runs are on offer. But the middle phase could be really tricky at this venue as spinners come into play and are highly effective. Teams chasing have had the upperhand in ODI’s at Trent Bridge and the average 1st innings score is around 250-260 runs.
In T20I’s the conditions are much more balanced where an equal competition between bat & ball is always on the cards. More often than not the matches at Trent Bridge have gone down the wire. Teams batting 1st won more than 50% of the matches played and the average 1st innings score is around 165-180 runs.
When it comes to the Vitality T20 Blast at the start of the season the pitch favours the batters. As the season progresses the scores drop down to 150-160 runs where it is challenging to score runs. Teams batting 1st won close to 60% of the games, while the team bowling first won 40% of the matches. The average 1st innings score is around 175-190 runs.
FAQ’s
Trent Bridge, Nottingham Pitch Report in T20’s ?
The pitch favours both the batters and the average 1st innings score is around 175-190 runs.
Trent Bridge, Nottingham Pitch Report ODI’s ?
A balanced track is always on the cards at Nottingham in ODI’s and the average 1st innings score is around 250-260 runs.


